February 7, 2023
Powering a Research Institution
The energy sources and usages of ISTA and measures to improve.
Not only a crisis of energy but also one of climate change demands a thorough look into the energy sources and consumption of an institution. ISTA’s energy report reveals that a newly built and expanding campus certainly has benefits in terms of efficiency and sustainability, but there are still potentials to be exploited.
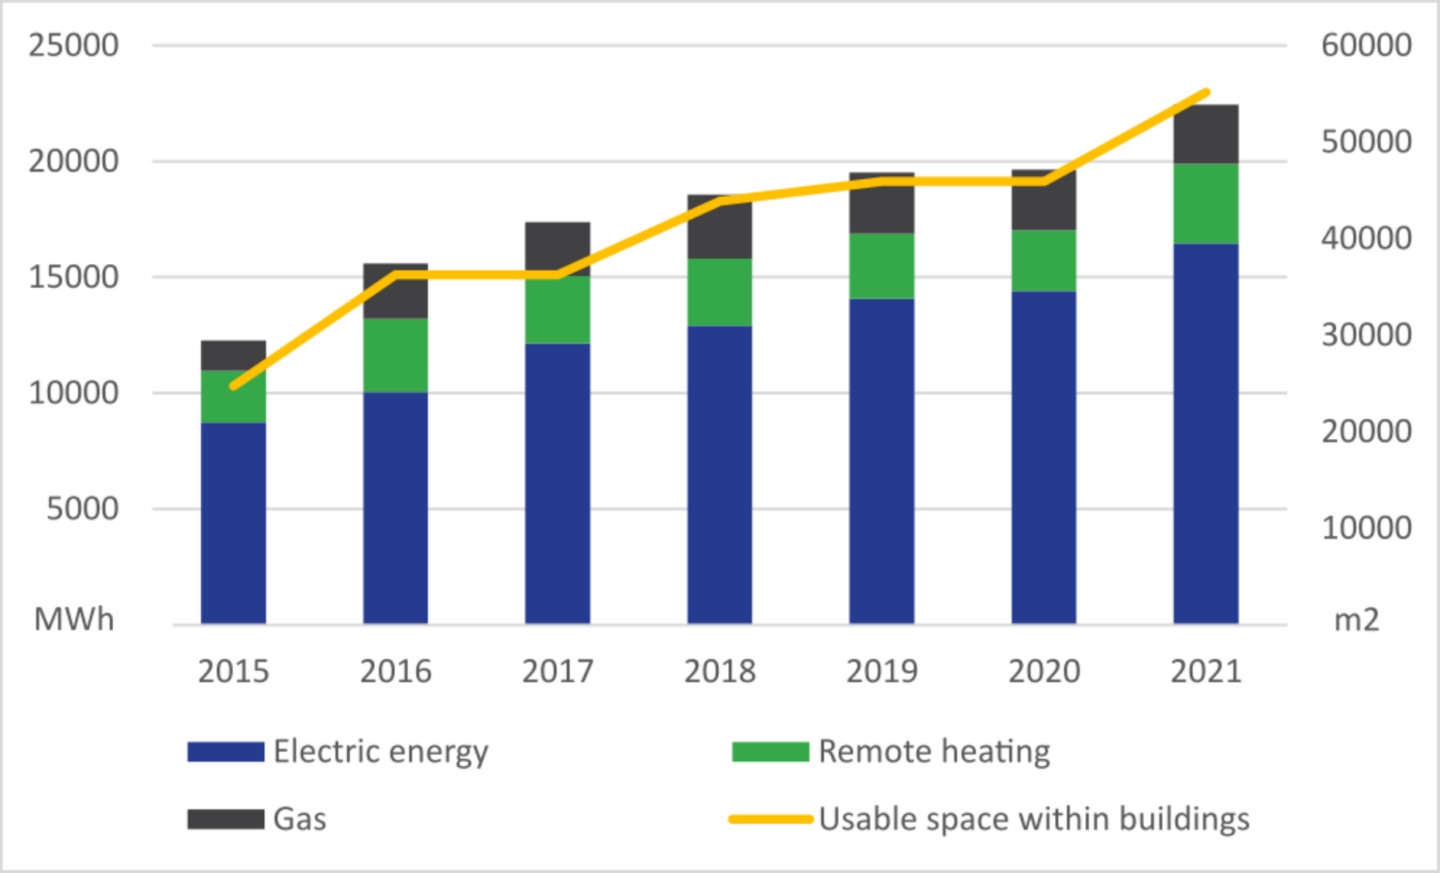
As a research facility, we find ourselves in a dilemma: We comprehend the urgent need for climate action and energy-saving measures. At the same time, basic research needs energy – frankly speaking, quite a lot of it. At ISTA, we operate supercomputing clusters for modeling, machine learning, and simulations, experiments with high-tech equipment, and laboratories that require finely tuned conditions. Together with office buildings and infrastructure of more than 50,000 m2 for the Institute’s 1,000 employees, the whole campus required 22,438 MWh in 2021. In comparison, a standard household in Austria requires approximately 19 MWh per year or 9 MWh per person [1, 2].

Where does it come from – where does it go?
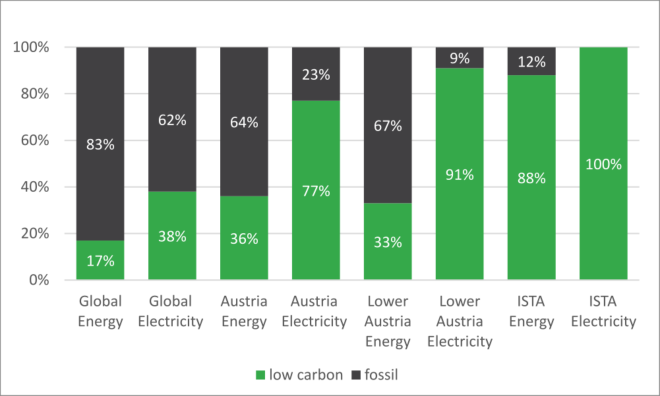
There are three major sources of ISTA’s energy: the electricity grid (73 %), a nearby biomass heating plant (15 %), and fossil gas (12 %). Fortunately, the Institute resides in Lower Austria, an Austrian province that produces more renewable electricity than it consumes [3], meaning hydro-, wind-, biomass- or solar power. Furthermore, ISTA chose an electricity plan that guarantees hundred percent renewable electricity.
In 2021, the overall energy consumption however in Lower Austria was consistent of only 33 percent renewables – where it is still heavily dependent on fossil oil and gas [4]. Nonetheless, it lies in stark contrast to the global energy mix, where 38 percent of the world’s electricity and only 17 percent of the world’s energy consumption originate from low-carbon sources (nuclear or renewables) [5, 6]. At ISTA, we limit the use of fossil gas to certain aspects in the laboratories, for example, steam generation or gas burners.
Looking at the consumption of the 22,438 MWh of energy at ISTA, four major categories can be identified: electricity (52 %), steam production (19 %), heating (17 %), and cooling (12 %). Cooling and heating are applied to office spaces to maintain reasonable working conditions; laboratory settings often require more nuanced control. The Preclinical Facility that hosts animals with the highest standards of animal care, and the Plant Facility with its thousands of seedlings need well-defined temperatures as well as lighting. Yet, certain laboratories even require precise and constant humidity, which explains the amount of steam production at ISTA. Energy is also used for cooling systems, which are essential for daily lab work e.g. laboratory freezers.
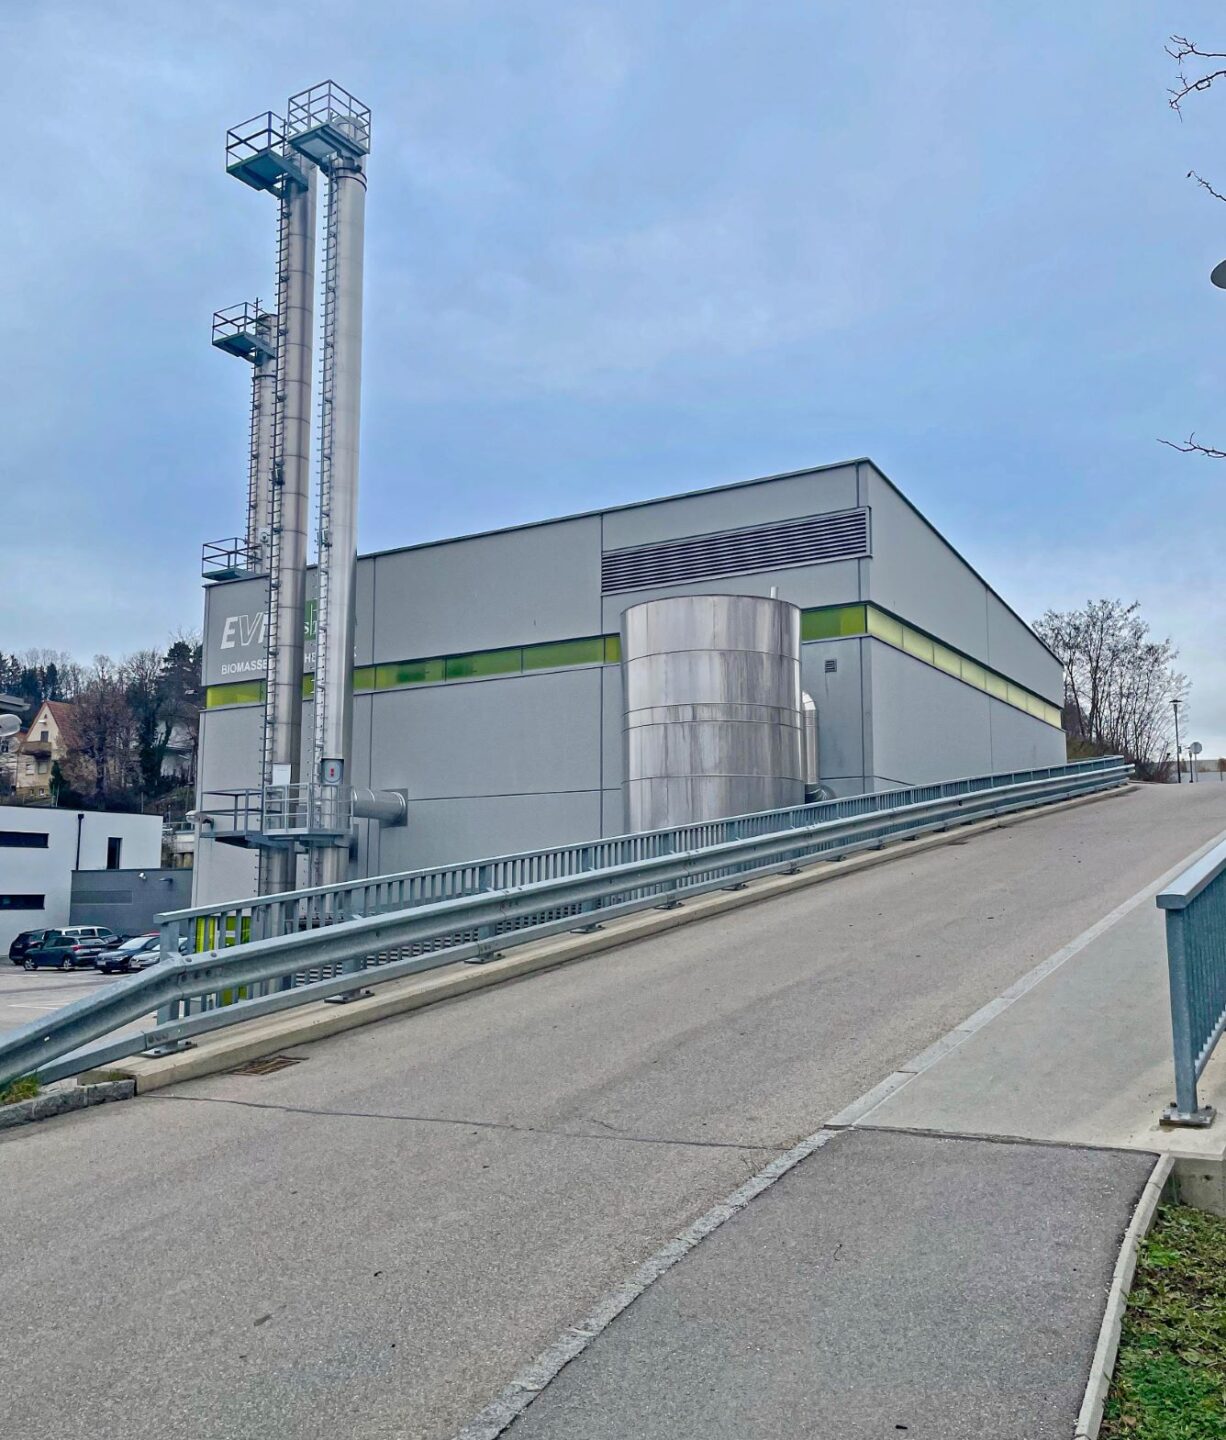
On-site biomass plant
A prescient decision to build a biomass plant right on campus proved valuable when oil and gas prices rose. From October to May, the biomass heating plant supplies the entire campus with thermal energy in the form of sustainable heat from renewable resources. Local suppliers provide the wood chips. In 2021, the heating plant contributed 3,424 MWh of a total of 5,642 MWh for general heating, with the rest coming from heat pumps (1,099 MWh) and heat recovery cooling machines (1,119 MWh).
Let’s act together – avenues for improvement
Both energy and costs could be saved in the winter of 2022/23 due to a lowering of the temperature in office spaces from 22 °C to 19.5 °C. Numbers are still to be evaluated. Another avenue of improvement is an intelligent control system. The “Campus Brain” consists of more than 100,000 sensors that provide data points for automatic regulation of ventilation, temperature, humidity, and lighting. Especially, energy-intensive experimental setups are currently under investigation. The goal is to optimize their settings without causing changes to their measurements. Utilizing or shielding the sun promises further benefits. ISTA continuously expands the number of photovoltaic panels and exterior solar shades that help keep indoor spaces cool, ideally even providing electricity instead of using it.
Sources
[1] Statistik Austria – overall energy consumption of households 2019/20: 284,871 TJ. https://www.statistik.at/statistiken/energie-und-umwelt/energie/energieeinsatz-der-haushalte[2] Statistik Austria – Austrian private households (2021): 4,019,700 households; 2.19 people per household. https://www.statistik.at/statistiken/bevoelkerung-und-soziales/bevoelkerung/familien-haushalte-lebensformen/privathaushalte
[3] Lower Austrian electricity consumption (2021): Lower Austria consumed 11,7 TWh of electricity and produced 12,6 TWh of renewable electricity. Production splits into six large and 560 small hydropower plants (57 %), 735 wind engines (32 %), 108 biomass plants (7 %), and 58,092 photovoltaic compounds (4 %). https://www.energie-noe.at/stromversorgung
[4] Ministry for Climate Action, Environment, Energy, Mobility, Innovation and Technology – Energy in Austria (2022), page 48. https://www.bmk.gv.at/themen/energie/publikationen/zahlen.html
[5] Our World in Data – Energy mix (2021): https://ourworldindata.org/energy-mix
[6] Our World in Data – Electricity mix (2021): https://ourworldindata.org/electricity-mix
